QAF-PCT
Quality Assessment Framework for Photon Counting CT
A comprehensive web-based platform for advanced photon counting CT image quality evaluation. Analyze DICOM images, calculate SNR, NPS, MTF, and perform material identification with powerful tools designed for researchers and medical professionals.
Analysis Capabilities
Photon Counting CT
This application is feasible for clinical PCD (Photon Counting Detector) image quality assessment as well as for research purposes to fulfill researchers' basic analysis needs. The platform supports both clinical workflow integration and advanced research applications, providing comprehensive tools for image quality evaluation across different scanner configurations.
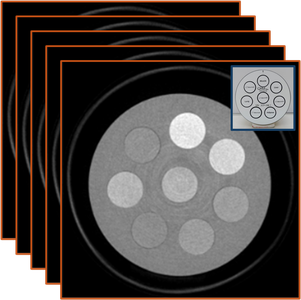
Energy Images
Multi-energy photon counting energy images provide spectral information by separating X-ray photons into different energy bins. This enables material decomposition and enhanced contrast visualization for improved diagnostic capabilities in medical imaging.
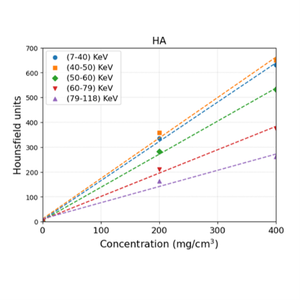
Linear Regression Response
Linear regression analysis evaluates the relationship between material concentrations and measured CT values across different energy bins. This analysis ensures accurate material quantification and verifies the linear response characteristics of the spectral CT system.
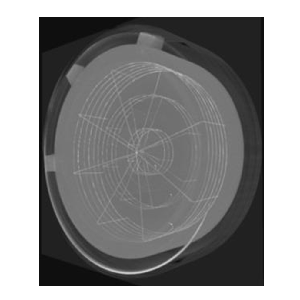
Resolution of SPCCT Images
Spatial resolution analysis measures the ability of the SPCCT system to distinguish fine details and structures. The Modulation Transfer Function (MTF) quantifies how well the system preserves contrast at different spatial frequencies, critical for evaluating image sharpness and detail visibility in photon counting CT imaging.
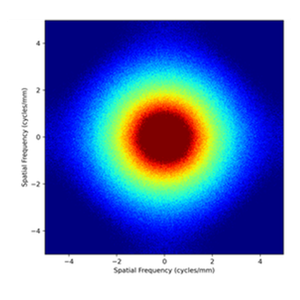
2D Noise Power Spectrum (NPS)
The 2D Noise Power Spectrum (NPS) characterizes the spatial frequency content of noise in a medical image across two dimensions. It quantifies how noise is distributed across different spatial frequencies in the x-y plane, providing essential information for image quality assessment and system optimization through comprehensive noise analysis.
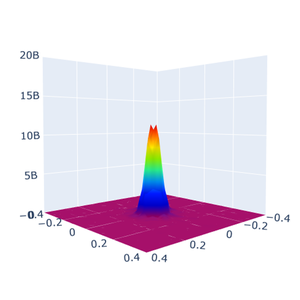
3D Noise Power Spectrum (NPS)
The 3D Noise Power Spectrum (NPS) provides complete three-dimensional noise characterization showing noise power distribution in all three spatial dimensions (x, y, z). This comprehensive analysis offers the most detailed noise assessment, enabling thorough evaluation of system performance across the entire image volume.
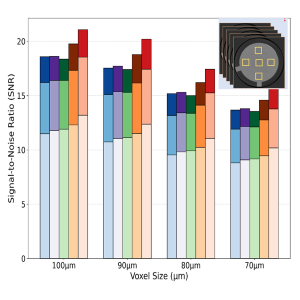
Signal-to-Noise Ratio (SNR)
Signal-to-Noise Ratio (SNR) is a fundamental image quality metric that quantifies the ratio of signal strength to noise level in an image. Higher SNR values indicate better image quality with less noise relative to the signal, making it essential for evaluating diagnostic image quality and system performance.
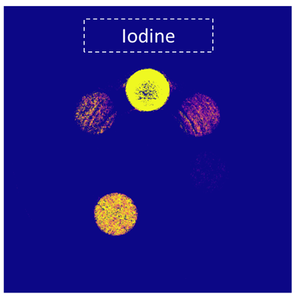
Material Decomposition Images
Material decomposition utilizes spectral CT data to separate multi-energy images into material-specific basis images (e.g., water, iodine, calcium). This advanced technique enables precise material identification and quantification, supporting enhanced diagnostic capabilities and research applications in spectral photon counting CT imaging.
Platform Features
Image Quality Analysis
Comprehensive SNR, NPS, MTF, and linearity analysis for complete image quality assessment
Material Identification
Advanced material identification and quantification from spectral CT data
Database Management
Store and manage DICOM data with multi-energy bin support
Analysis Tools
Histogram, Line Profile, HU Conversion, and visualization tools